Note
Go to the end to download the full example code or to run this example in your browser via Binder
Multivariate from independent marginals and copula
How to define α bivariate distribution from independent marginals and change its structure based on a copula supported by UQpy
How to plot the pdf of the distribution
How to modify the parameters of the distribution
Import the necessary modules.
import numpy as np
import matplotlib.pyplot as plt
Example of a multivariate distribution from joint independent marginals
from UQpy.distributions import Normal, JointIndependent
from UQpy.distributions import Gumbel, JointCopula
Define a Copula
The definition of bivariate distribution with a copula, is similar to defining a multivariate distribution from independent marginals. In both cases a list of marginals needs to be defined. In case of
marginals = [Normal(loc=0., scale=1), Normal(loc=0., scale=1)]
copula = Gumbel(theta=3.)

# dist_1 is a multivariate normal with independent marginals
dist_1 = JointIndependent(marginals)
print('Does the distribution with independent marginals have an rvs method?')
print(hasattr(dist_1, 'rvs'))

# dist_2 exhibits dependence between the two dimensions, defined using a gumbel copula
dist_2 = JointCopula(marginals=marginals, copula=copula)
print('Does the distribution with copula have an rvs method?')
print(hasattr(dist_2, 'rvs'))
Does the distribution with independent marginals have an rvs method?
True
Does the distribution with copula have an rvs method?
False
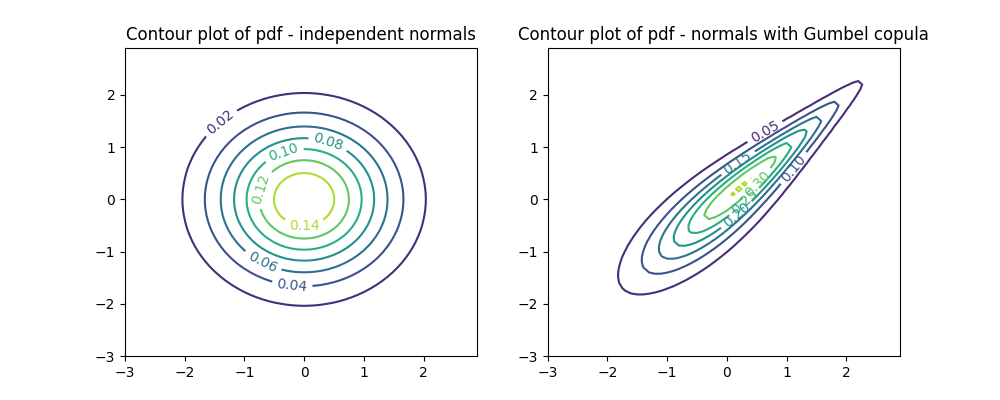
Plot the pdf of the distribution before and after the copula
fig, ax = plt.subplots(ncols=2, figsize=(10, 4))

x = np.arange(-3, 3, 0.1)
y = np.arange(-3, 3, 0.1)
X, Y = np.meshgrid(x, y)
Z = dist_1.pdf(x=np.concatenate([X.reshape((-1, 1)), Y.reshape((-1, 1))], axis=1))
CS = ax[0].contour(X, Y, Z.reshape(X.shape))
ax[0].clabel(CS, inline=1, fontsize=10)
ax[0].set_title('Contour plot of pdf - independent normals')

x = np.arange(-3, 3, 0.1)
y = np.arange(-3, 3, 0.1)
X, Y = np.meshgrid(x, y)
Z = dist_2.pdf(x=np.concatenate([X.reshape((-1, 1)), Y.reshape((-1, 1))], axis=1))
CS = ax[1].contour(X, Y, Z.reshape(X.shape))
ax[1].clabel(CS, inline=1, fontsize=10)
ax[1].set_title('Contour plot of pdf - normals with Gumbel copula')
plt.show()
Modify the parameters of the multivariate copula.
Use the update_parameters method.
print(dist_2.copula.parameters)
dist_2.update_parameters(theta_c=2.)
print(dist_2.copula.parameters)
{'theta': 3.0}
{'theta': 2.0}
Total running time of the script: ( 0 minutes 0.135 seconds)