Note
Go to the end to download the full example code or to run this example in your browser via Binder
Parameter estimation using Importance Sampling - Probability Model
In the following we learn the mean and covariance of a univariate gaussian distribution from data.
Initially we have to import the necessary modules.
import numpy as np
import matplotlib.pyplot as plt
from UQpy.inference import DistributionModel, BayesParameterEstimation
from sklearn.neighbors import KernelDensity  # for the plots
from UQpy.distributions import JointIndependent, Uniform, Lognormal, Normal

def pdf_from_kde(domain, samples1d):
    bandwidth = 1.06 * np.std(samples1d) * samples1d.size ** (-1 / 5)
    kde = KernelDensity(bandwidth=bandwidth).fit(samples1d.reshape((-1, 1)))
    log_dens = kde.score_samples(domain)
    return np.exp(log_dens)
First, for the sake of this example, we generate fake data from a gaussian distribution with mean 10 and standard deviation 1.
# Generate data from a probability model, here a Gaussian pdf, then learn its parameters,
# mean and covariance, from this data

np.random.seed(100)
mu, sigma = 10, 1  # true mean and standard deviation
data = np.random.normal(mu, sigma, 100).reshape((-1, 1))
np.random.seed()

# plot the data and true distribution
count, bins, ignored = plt.hist(data, 30, density=True)
plt.plot(bins, 1 / (sigma * np.sqrt(2 * np.pi)) * np.exp(- (bins - mu) ** 2 / (2 * sigma ** 2)),
         linewidth=2, color='r')
plt.title('data as histogram and true distribution to be estimated')
plt.show()


p0 = Uniform(loc=0., scale=15)
p1 = Lognormal(s=1., loc=0., scale=1.)
prior = JointIndependent(marginals=[p0, p1])

# create an instance of class Model
candidate_model = DistributionModel(distributions=Normal(loc=None, scale=None), n_parameters=2, prior=prior)

Learn the unknown parameters using ImportanceSampling. If no proposal is given, the samples are sampled
from the prior.
from UQpy.sampling import ImportanceSampling
sampling = ImportanceSampling()
bayes_estimator = BayesParameterEstimation(sampling_class=sampling,
inference_model=candidate_model,
data=data,
nsamples=50000)
s_prior = bayes_estimator.sampler.samples
bayes_estimator.sampler.resample()
s_posterior = bayes_estimator.sampler.unweighted_samples
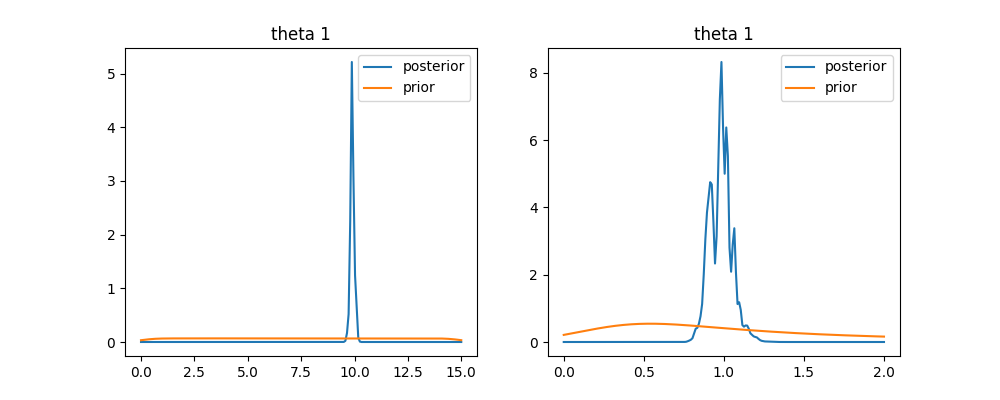
# print results
fig, ax = plt.subplots(1, 2, figsize=(10, 4))
domain = np.linspace(0, 15, 200)[:, np.newaxis]
pdf_ = pdf_from_kde(domain, s_posterior[:, 0])
ax[0].plot(domain, pdf_, label='posterior')
pdf_ = pdf_from_kde(domain, s_prior[:, 0])
ax[0].plot(domain, pdf_, label='prior')
ax[0].legend()
ax[0].set_title('theta 1')
domain = np.linspace(0, 2, 200)[:, np.newaxis]
pdf_ = pdf_from_kde(domain, s_posterior[:, 1])
ax[1].plot(domain, pdf_, label='posterior')
pdf_ = pdf_from_kde(domain, s_prior[:, 1])
ax[1].plot(domain, pdf_, label='prior')
ax[1].legend()
ax[1].set_title('theta 1')
plt.show()
Total running time of the script: ( 0 minutes 6.012 seconds)