Note
Go to the end to download the full example code or to run this example in your browser via Binder
Rectangular Stratified Sampling
In this example, the stratified sampling method is employed to generate samples from an exponential distribution.
Import the necessary libraries. Here we import standard libraries such as numpy and matplotlib, but also need to
import the TrueStratifiedSampling class from UQpy.sampling.
from UQpy.sampling.stratified_sampling.TrueStratifiedSampling import TrueStratifiedSampling
from UQpy.distributions import Exponential
import numpy as np
import matplotlib.pyplot as plt
from scipy.stats import expon
from UQpy.sampling.stratified_sampling.strata import RectangularStrata
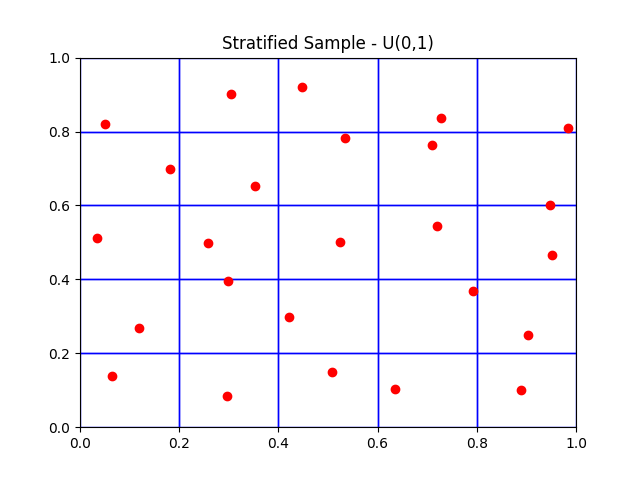
Run TrueStratifiedSampling for 25 samples.
2 dimensions
Five strata in each dimension
Exponential distribution with location parameter = 1 and scale parameter = 1.
Create a distribution object.
marginals = [Exponential(loc=1., scale=1.), Exponential(loc=1., scale=1.)]
Create strata with equal volume
Create a strata object using RectangularStrata class.
strata = RectangularStrata(strata_number=[5, 5])
Generate samples using TrueStratifiedSampling class, one sample is generate inside each stratum.
x_sts = TrueStratifiedSampling(distributions=marginals,
                               strata_object=strata,
                               nsamples_per_stratum=1)
Plot the resulting stratified samples and the boundaries of the strata in the \(U(0,1)\) space.
fig = strata.plot_2d()
plt.title('Stratified Sample - U(0,1)')
plt.scatter(x_sts.samplesU01[:, 0], x_sts.samplesU01[:, 1], color='r')
plt.ylim(0, 1)
plt.xlim(0, 1)
plt.show()


print(x_sts.weights)
[0.04 0.04 0.04 0.04 0.04 0.04 0.04 0.04 0.04 0.04 0.04 0.04 0.04 0.04
 0.04 0.04 0.04 0.04 0.04 0.04 0.04 0.04 0.04 0.04 0.04]
Plot the resulting stratified exponential samples and the boundaries of the strata in the exponential space.
fig, ax = plt.subplots()
plt.title('Stratified Sample - Exponential')
plt.scatter(x_sts.samples[:, 0], x_sts.samples[:, 1])
ax.set_yticks([1.0, expon.ppf(0.2, 1, 1), expon.ppf(0.4, 1, 1), expon.ppf(0.6, 1, 1), expon.ppf(0.8, 1, 1),
               expon.ppf(0.99, 1, 1)])
ax.set_xticks([1.0, expon.ppf(0.2, 1, 1), expon.ppf(0.4, 1, 1), expon.ppf(0.6, 1, 1), expon.ppf(0.8, 1, 1),
               expon.ppf(0.99, 1, 1)])
ax.yaxis.grid(True)
ax.xaxis.grid(True)
plt.ylim(1, expon.ppf(0.99, 1, 1))
plt.xlim(1, expon.ppf(0.99, 1, 1))
plt.show()

print(x_sts.samples)

[[1.06747969 1.1476857 ]
 [1.35088007 1.08848268]
 [1.70971223 1.16154741]
 [2.00944686 1.10808709]
 [3.20143124 1.10579233]
 [1.12696147 1.31286982]
 [1.35529156 1.50162259]
 [1.54746999 1.35553594]
 [2.57394918 1.46039875]
 [3.33062399 1.28660311]
 [1.03400835 1.71505305]
 [1.29919453 1.68834455]
 [1.74173834 1.6955551 ]
 [2.26988974 1.78513653]
 [4.01017631 1.62498802]
 [1.20050619 2.19993679]
 [1.43544144 2.05890816]
 [1.76529376 2.52148202]
 [2.23453661 2.44300227]
 [3.93930259 1.92154706]
 [1.05156352 2.70996901]
 [1.36170414 3.31801085]
 [1.59300373 3.52495366]
 [2.30208459 2.8156912 ]
 [5.15123197 2.65657644]]
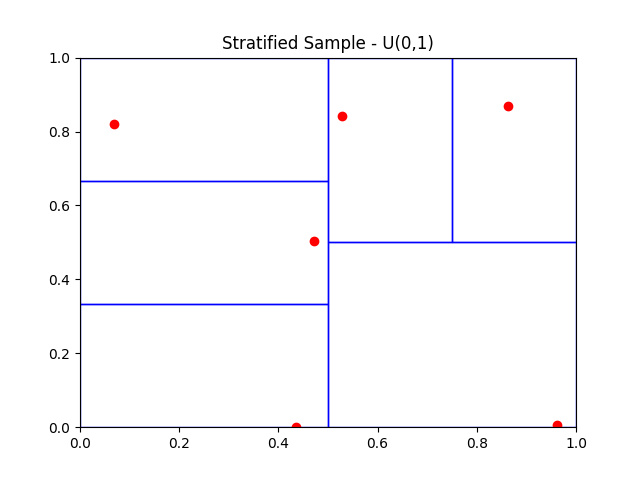
Create stratification using seeds and widths
Strata object can be initiated by defining seeds and widths of the strata.
Generate samples using TrueStratifiedSampling class. User can control the number of samples
generated inside each stratum. In this illustration, 10 samples are generated such that
nsamples_per_stratum governs the number of samples.
sts_obj = TrueStratifiedSampling(distributions=marginals, strata_object=strata_obj, random_state=20)
sts_obj.run(nsamples_per_stratum=[1, 2, 3, 4])
Plot show the strata and samples generated in each stratum.
fig = strata_obj.plot_2d()
plt.title('Stratified Sample - U(0,1)')
plt.scatter(sts_obj.samplesU01[:, 0], sts_obj.samplesU01[:, 1], color='r')
plt.ylim(0, 1)
plt.xlim(0, 1)
plt.show()

Probability weights corresponding to each sample computed using Stratified sampling.
array([0.2       , 0.15      , 0.15      , 0.06666667, 0.06666667,
       0.06666667, 0.075     , 0.075     , 0.075     , 0.075     ])
Create stratification using input file
Strata object can be defined using an input file, which contains the seeds and widths of each stratum.
strata_obj1 = RectangularStrata(input_file='strata.txt')
Generate samples inside each stratum using TrueStratifiedSampling class.
sts_obj1 = TrueStratifiedSampling(distributions=marginals, strata_object=strata_obj1, nsamples_per_stratum=1)

fig = strata_obj1.plot_2d()
plt.title('Stratified Sample - U(0,1)')
plt.scatter(sts_obj1.samplesU01[:, 0], sts_obj1.samplesU01[:, 1], color='r')
plt.ylim(0, 1)
plt.xlim(0, 1)
plt.show()
Proportional sampling
TrueStratifiedSampling class can generate samples proportional to volume of each stratum.
strata_obj.random_state = 24
sts_obj2 = TrueStratifiedSampling(distributions=marginals, strata_object=strata_obj)
sts_obj2.run(nsamples=10)
It can be noticed that new sample in each stratum is proportional to volume.
print('Volume: ', sts_obj2.strata_object.volume)
print('Number of samples in each stratum: ', sts_obj2.nsamples_per_stratum)


fig = strata_obj.plot_2d()
plt.title('Stratified Sample - U(0,1)')
plt.scatter(sts_obj.samplesU01[:, 0], sts_obj.samplesU01[:, 1], color='r')
plt.ylim(0, 1)
plt.xlim(0, 1)
plt.show()

Volume:  [0.2 0.3 0.2 0.3]
Number of samples in each stratum:  [2. 3. 2. 3.]
Total running time of the script: ( 0 minutes 0.224 seconds)