Note
Go to the end to download the full example code or to run this example in your browser via Binder
2-dimensional g-function
Initially we have to import the necessary modules.
import shutil

from UQpy.run_model.model_execution.PythonModel import PythonModel
from UQpy.run_model.RunModel import RunModel
from UQpy.distributions import Uniform
from UQpy.sensitivity import MorrisSensitivity
import numpy as np
import matplotlib.pyplot as plt
Set-up problem with g-function.
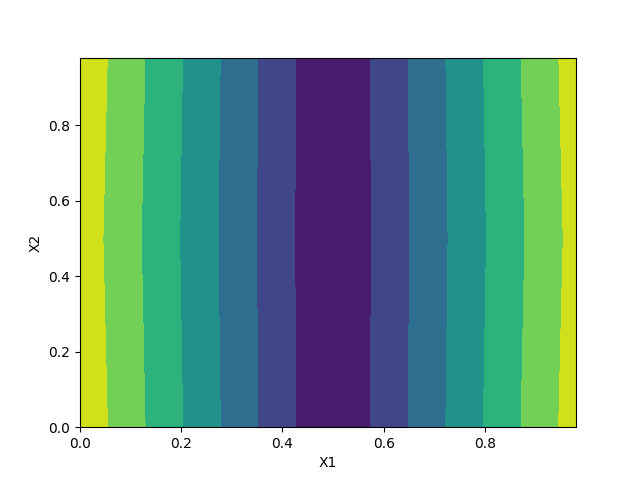
First plot contour of the function, clearly X2 has little influence on the function compared to X1.
x = np.arange(0, 1, 0.02)
y = np.arange(0, 1, 0.02)
xx, yy = np.meshgrid(x, y, sparse=False)
runmodel_object.run(samples=np.vstack([xx.reshape((-1,)), yy.reshape((-1,))]).T, append_samples=False)
h = plt.contourf(x, y, np.array(runmodel_object.qoi_list).reshape(xx.shape))
plt.xlabel('X1')
plt.ylabel('X2')
plt.show()
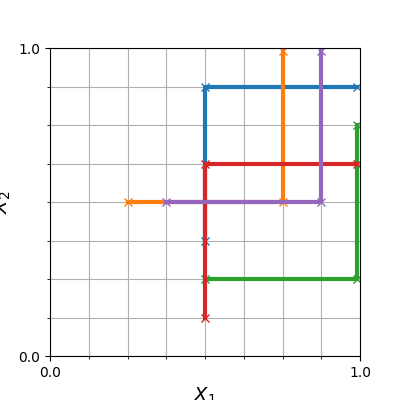
sens = MorrisSensitivity(runmodel_object=runmodel_object,
distributions=dist_object,
n_levels=9)
sens.run(n_trajectories=10)
fig, ax = plt.subplots(figsize=(4, 4))
for trajectory in sens.trajectories_physical_space[:5]:
ax.plot(trajectory[:, 0], trajectory[:, 1], marker='x', linewidth=3)
ax.set_xlim([0, 1])
ax.set_ylim([0, 1])
ax.set_xticks(np.arange(0., 1. + 0.5 / (sens.n_levels - 1), 1. / (sens.n_levels - 1)), minor=True)
ax.set_xticks([0., 1.], minor=False)
ax.set_xticklabels([0., 1.])
ax.set_yticks(np.arange(0., 1. + 0.5 / (sens.n_levels - 1), 1. / (sens.n_levels - 1)), minor=True)
ax.set_yticks([0., 1.], minor=False)
ax.set_yticklabels([0., 1.])
ax.grid(True, which='both')
ax.set_xlabel(r'$X_{1}$', fontsize=14)
ax.set_ylabel(r'$X_{2}$', fontsize=14)
plt.show()
print(['a{}={}'.format(i + 1, ai) for i, ai in enumerate(a_values)])
fig, ax = plt.subplots()
ax.scatter(sens.mustar_indices, sens.sigma_indices)
for i, (mu, sig) in enumerate(zip(sens.mustar_indices, sens.sigma_indices)):
ax.text(x=mu + 0.01, y=sig + 0.01, s='X{}'.format(i + 1))
ax.set_xlabel(r'$\mu^{\star}$', fontsize=14)
ax.set_ylabel(r'$\sigma$', fontsize=14)
ax.set_title('Morris sensitivity indices', fontsize=16)
plt.show()

['a1=0.001', 'a2=99.0']
Total running time of the script: ( 0 minutes 0.166 seconds)