Note
Go to the end to download the full example code or to run this example in your browser via Binder
12-dimensional g-function
To be compared with results from “An effective screening design for sensitivity analysis of large models”, Campolongo et al, 2007
Initially we have to import the necessary modules.
import shutil
from UQpy.run_model.model_execution.PythonModel import PythonModel
from UQpy.run_model.RunModel import RunModel
from UQpy.distributions import Uniform
from UQpy.sensitivity import MorrisSensitivity
import matplotlib.pyplot as plt
Set-up problem with g-function.
a_values = [0.001, 89.9, 5.54, 42.10, 0.78, 1.26, 0.04, 0.79, 74.51, 4.32, 82.51, 41.62]
na = len(a_values)
model = PythonModel(model_script='local_pfn.py', model_object_name='gfun_sensitivity', delete_files=True,
a_values=a_values, var_names=['X{}'.format(i) for i in range(na)])
runmodel_object = RunModel(model=model)
dist_object = [Uniform(), ] * na
sens = MorrisSensitivity(runmodel_object=runmodel_object,
distributions=dist_object,
n_levels=20,
maximize_dispersion=True)
sens.run(n_trajectories=10)
print(['a{}={}'.format(i + 1, ai) for i, ai in enumerate(a_values)])
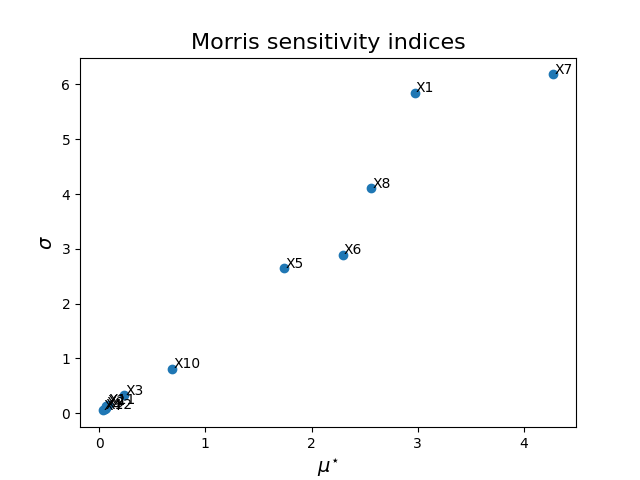
fig, ax = plt.subplots()
ax.scatter(sens.mustar_indices, sens.sigma_indices)
for i, (mu, sig) in enumerate(zip(sens.mustar_indices, sens.sigma_indices)):
ax.text(x=mu + 0.01, y=sig + 0.01, s='X{}'.format(i + 1))
ax.set_xlabel(r'$\mu^{\star}$', fontsize=14)
ax.set_ylabel(r'$\sigma$', fontsize=14)
ax.set_title('Morris sensitivity indices', fontsize=16)
plt.show()
['a1=0.001', 'a2=89.9', 'a3=5.54', 'a4=42.1', 'a5=0.78', 'a6=1.26', 'a7=0.04', 'a8=0.79', 'a9=74.51', 'a10=4.32', 'a11=82.51', 'a12=41.62']
Total running time of the script: ( 0 minutes 0.875 seconds)