Note
Go to the end to download the full example code or to run this example in your browser via Binder
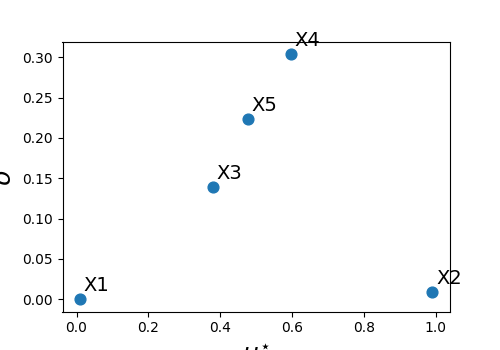
Function with nonlinearities / parameter dependencies
\[Y = h(X) = 0.01 X_{1} + 1.0 X_{2} + 0.4 X_{3}^{2} + X_{4} X_{5}\]
ranking of input parameters:
\(X_{1}\) is non-influential
\(X_{2}\) is influential, linear/additive effect (expect large \(\mu^{\star}\) and small \(\sigma\))
\(X_{3}\) is somewhat influential, nonlinear effect,
\(X_{4}, X_{5}\) are influential with dependence
Initially we have to import the necessary modules.
import shutil

from UQpy.run_model.RunModel import RunModel
from UQpy.run_model.model_execution.PythonModel import PythonModel
from UQpy.distributions import Uniform
from UQpy.sensitivity import MorrisSensitivity
import matplotlib.pyplot as plt
Set-up problem with g-function.
model = PythonModel(model_script='local_pfn.py', model_object_name='fun2_sensitivity', delete_files=True,
                    var_names=['X{}'.format(i) for i in range(5)])
runmodel_object = RunModel(model=model)

dist_object = [Uniform(), ] * 5


sens = MorrisSensitivity(runmodel_object=runmodel_object,
                         distributions=dist_object,
                         n_levels=20, maximize_dispersion=True)
sens.run(n_trajectories=10)


fig, ax = plt.subplots(figsize=(5, 3.5))
ax.scatter(sens.mustar_indices, sens.sigma_indices, s=60)
for i, (mu, sig) in enumerate(zip(sens.mustar_indices, sens.sigma_indices)):
    ax.text(x=mu + 0.01, y=sig + 0.01, s='X{}'.format(i + 1), fontsize=14)
ax.set_xlabel(r'$\mu^{\star}$', fontsize=18)
ax.set_ylabel(r'$\sigma$', fontsize=18)
# ax.set_title('Morris sensitivity indices', fontsize=16)
plt.show()
Total running time of the script: ( 0 minutes 0.986 seconds)